Tag Archives: Javascript

Web development in 2017 – A Journey part II: VSCode and Git

The second part in this series is about what and how to install the tooling you need nowadays. No more Notepad, I’m afraid…

Please note: work in progress. This article will be updated to reflect new insights.

To install

 
Remember the previous article? Well, here are the first two tools to install. Just click on the link to jump to the relevant section if you’re impatient:

Make is no longer on the list, because Make isn’t worth the bother of installing Cygwin. Yes, I agree that if you do not install Git, you need to install Cygwin for the GNU Core Utilities. But as they come with Git who has its own version of them, I think that all the hassle you have to go through to get Git and Cygwin working together just isn’t worth it. However, for those foolhardy enough to want to experiment, I’ll explain how to run them side by side in a separate post.

Node.js and related tooling will be discussed in the next post. First, we discuss VS Code and Git.


Visual Studio Code

back to top
First, download and install Visual Studio Code . Just click on “Download for Windows (stable build)” and install the download. If for some arcane reason you’re not working on a Windows system, just click on the dropdown icon next to the download button and select a relevant installer or package.

During the installation of the fairly small (37.2 MB) package, you get a number of questions eventually that ask you whether to add context menu’s, register the editor for the relevant filetypes and add the path to Code to the Windows path. Something similar will likely happen on other platforms. My urgent advice is to check all the boxes, unless you already have another development IDE installed (such as Visual Studio). I’d still register Code for everything, but afterwards restart the other IDE and make sure you register the filetypes for that IDE again. Or don’t register and do this manually. I just register the editor for everything, because nothing is as annoying as clicking a .js file and starting an interpreter or worse, Visual Studio itself.

Once installed, verify that all is working by starting Code. If all went well, this can be done from the commmandline, shell or whatever you use. Type “code” and the editor should start.

It is possible that you get a warning about a typescript compiler. In that case install the correct typescript compiler in NPM (using the indicated version) with the command “npm install -g typescript@2.3.2”. This will install version 2.3.2, replace it if Code needs a different version. If there is an older version of typescript already installed, you can remove it with “npm uninstall -g typescript”.

But we will assume that Code starts just fine. In that case we will first set our preferences. Go to File/Preferences and select the Color Theme (“Tomorrow Night Blue” for me) and File Icon Theme (I use the VSCode Icons but Seti is the popular choice and it’s easy to see why). Just select File / Open Folder and open a folder with source code to check what your icons look like.

Then, we add extensions. Open them with the menu on the left side, or with Ctrl-Shift-X. I installed the following extensions:

  • Git Lens

    Git Lens helps you to easily see who changed what in your source code and also get some graphical information on Git commits. It gives you the ability to open older versions of a file, or the same file on Github, or compare it. It shows commits and annotations and a whole host of other items. More even than I currently know. So just install it.

  • Gitignore
    This plugin downloads gitignore files for your specific project. Very helpful, but usually only once.

  • Languange-stylus

    If you use Stylus for CSS, this add-in makes sure you get syntax coloring and checking.

  • Auto-Open Markdown Preview
    A very useful extension that just opens the preview of any given MarkDown-syntax file. Especially useful when editing open-source packages that almost always require a README.md file.

  • ESLint

    ESLint promotes best practices and syntax checking, is very flexible and can include your own rules. However, I found it to be pretty annoying to set up and get working without a gazillion errors (or none at all). If you do this, best follow the instructions on the website. It’s really quite good, but JSHint works out of the box, and ESLint doesn’t provide much value without changing the configuration file. See https://github.com/feross/eslint-config-standard/blob/master/eslintrc.json for an (overly complex) example. That said, it’s rapidly becoming THE linting tool of choice. So for futureproofing it might be your best bet.

    “To sum up, JSHint can offer a solid set of basic rules and relatively fast execution, whereas ESLint offers all that one can want from a linter and then some more as long as he’s willing to put an effort in setting it up.” – Quora

    An alternative option for ESLint is JSHint. This will give very good warnings about JavaScript issues in your code. However, you will also need to install the npm module as well (we’ll get to that later) with the command “npm install -g jshint” which will install the actual syntax checker globally as a commandline tool. It could be installed per project as well, see the website for more details.
    When using it, insert the following line in functions where you use var declarations:
    'use strict';
    If you use import and export commands in for instance d3 plugins, use
    /*jshint esversion: 6 */
    as your first line in any javascript file.

    If you use JSHint then you better add the JSHint default config extension as well: using the command palette in VS Code (Ctrl+Shift+P) you can type “generate” and then generate a JSHint configuration file. Very nifty!

That’s it for the VS Code plugins. If you need more plugins, visit the marketplace and type “@recommended” to see recommended plugins.


Git

back to top

Pfew. Git. The mammoth of version control. If you need documentation, here is an extremely nice and well done tutorial. I’m just going to put down some basic points and then leave this topic alone.

First, install Git after downloading it. It installs itself as both a commandline tool, and comes with its own shell. If you’re into Unix shells, Git BASH is nice, and compatible with many open-source projects out there that use shell commands in their taskrunners (like Make). Personally I just use the CMD from windows, or PowerShell for special projects. Whatever you choose, after installing Git you have access to an updated version of the GNU core utilities, giving you tools as wc, grep, cat, less, vi, rm -rf, and many more.

Each project has its own repository, because Git works per repository (and separating them prevents accidents). Creating one is easy: just type “git init” in a commandline in the folder you want to have in Git. Git will create a subdirectory where it stores the repository. With a .gitignore-file you can tell Git to ignore files and folders. The syntax for that file is all over the web, but for firebase projects this is my .gitignore:

# Logs
logs
*.log
npm-debug.log*
yarn-debug.log*
yarn-error.log*

# Runtime data
pids
*.pid
*.seed
*.pid.lock

# Directory for instrumented libs generated by jscoverage/JSCover
lib-cov

# Coverage directory used by tools like istanbul
coverage

# nyc test coverage
.nyc_output

# Grunt intermediate storage (http://gruntjs.com/creating-plugins#storing-task-files)
.grunt

# Bower dependency directory (https://bower.io/)
bower_components

# node-waf configuration
.lock-wscript

# Compiled binary addons (http://nodejs.org/api/addons.html)
build/Release

# Dependency directories
functions/
/node_modules/
jspm_packages/

# Typescript v1 declaration files
typings/

# Optional npm cache directory
.npm

# Optional eslint cache
.eslintcache

# Optional REPL history
.node_repl_history

# Output of 'npm pack'
*.tgz

# Yarn Integrity file
.yarn-integrity

# dotenv environment variables file
.env

# firebase stuff
*.firebaserc

You can also get this from the Gitignore plugin in VS Code. Remember: .gitignore goes into the standard folder, not the .git repository folder…

Git commands

There are some very good Git manuals out there. A nice PDF to have is the Atlassian Git cheat sheet PDF. Atlassian also has a list of basic Git commands.
I recommend reading at least the basic manual if you haven’t worked with Git before, otherwise it will be difficult to understand what’s happening.

GitKraken

Something that will make Git easier to use is GitKraken. Once downloaded and installed, you can use this tool to visualize the Git branches and maintain them. For instance, you can combine a large number of commits into one single commit, to make your commit history much clearer. You can also operate on branches and create pull requests for open source software. In general, once you get into publishing open source software on GitHub, you really want to use this. Yes, you can do everything on the commandline, but it’s a hassle and GitKraken makes it much easier. You will still need to know the Git commands in order to use GitKraken, though.

Web Development in 2017 – A Journey part I

A few weeks ago, after publishing my Collatz calculator, I decided I was going to develop a small web application to practice modern web development. And along the way I quickly discovered that a WebApp in 2017 is not nearly the same as that same WebApp in 2007, or even 2015.

Please note: work in progress. This article will be updated to reflect new insights.

Choices, choices… and Firebase

Web Development in 2017 is not your father’s web development anymore. For one thing, it’s now completely dominated by JavaScript. There are applications where even the static HTML and CSS are rendered through three different frameworks. This even extends to the backend with Node.js – even thought it may not be optimal for your needs.

But that’s just the beginning. There are a ton of choices to be made – we are drowning in tools and frameworks, a surfeit of riches in fact. So we have to make choices fast and be prepared to change things around as we gain experience with the choices we made. The important part is to try and not paint ourselves into a corner. But… there are some choices that will have quite an impact.

The biggest impact is created by something I wanted to try for a while now, which is having my back-end not only hosted by another party, but developed and maintained as well: this is called Backend-As-A-Service (BaaS). With BaaS you don’t host your own back-end. You don’t even host it somewhere else. No, someone else is hosting a back-end for you somewhere, and you are allowed to use its standard functionality. This will usually include authorization and storage.


Facebook used to have a very nice BaaS-solution called Parse, but that one has been shut down because it was no longer part of Facebook’s strategy. They did offer a migration path to the open-sourced version though, and you can deploy that server on AWS or Heroku, so it is still a viable option. But I chose to go with a different platform.

Google is still in the BaaS business, with an offering called Firebase. I’m not going to detail Firebase, because extensive documentation is available on the Firebase website. I will however say that, just like Parse, it has (amongst others) the following functions:

  • Authentication
  • Database (with authorization rules)
  • Filestore
  • Message queues
  • Events

In the beginning I will limit myself to the use of Authentication and the Database.

Having made the choice for Firebase, we are now stuck with some others as well. Developing for the web in 2017 needs suitable tooling. And you cannot just buy Visual Studio and expect it to work. Firebase is based on Node.js, JavaScript and Web API’s. You need suitable tooling for that.

JavaScript, Typescript and ES6 compliancy

Funny as it sounds, we have to discuss the language we use first. We can chose TypeScript or JavaScript, and in JS we can choose ES6/ES2015 or ES5. The ES stands for ECMAScript, which is the actual name of JavaScript but noone calls it ECMASCript. If that sounds confusing it’s because it is, but here is a good explanation.

Typescript?

Typescript is nice. It checks your datatypes at compile time which prevents bugs. If you do back-end development in JavaScript, you should probably do TypeScript. But it also adds another compiler to an already unholy mess of libraries and supporting crutches. And it opens the door for things like the aptly named Babel. Before you know it, you start targeting ES6 JavaScript and you need *another* compiler, Babel, just because you wanted to use templating and arrow functions. But you have a lot of work to do before you can actually display “Hello, world!” on a page now. Getting that investment back is pretty hard on small applications. So I avoid TypeScript for now.

ES6/ES2015?

ES6 gives us all kinds of nice things like arrow functions, templating, and a whole array of syntactic sugar. But using it means using Babel to first compile the ES6 JavaScript into ES5, which can be understood by browsers and Node.js. It’s a dependency I can do without.

So my choice is standard ES5 JavaScript. Having settled that, we move on to the tooling to support this choice.

Mandatory tooling

Some tools are so important, doing without them means drastically reducing or even completely negating your development speed or ability to even develop anything at all. These are what I call the mandatory tools. Like a compiler and IDE for C++ development.

Text editor

So, you’re going to write a webpage. VI, notepad or notepad++ is what I used back in 1997. Actually, in 2015 as well. For application development in 2017 the choices are different though. It will be either Visual Studio Code, Atom or Sublime (paid software). Sure, you can try alternatives (try typing “code text editor” in Google for a pretty neat custom list), but chances are it’s one of those three. They all have integrated support for Git, syntax checking and coloring, starting terminals and debuggers from the editor, and extensive customization and plug-ins. I believe VS Code has about 12000 plugins and the other two are not far behind.

Node.js

You may not consider this a tool, but once you install Node.js you also get Node Package Manager and access to a gazillion extremely useful other packages. Like CSS precompilers, plugins, Firebase deployment software, task managers, source control software, and of course Node.js itself: a pretty powerful backend webserver. Install it, because frontend development in 2017 is impossible without it. And all web development is made easier once you have it.

Source Code Control System

Once you develop, you need source code control. You literally can’t do without. And while I do not particularly *like* Git, it’s so ubiquitous and integrated in almost any toolset nowadays, you have to have a really pressing argument to use something like Mercurial (which I like a lot better than Git, but sadly had to let go along with my teddybear when I grew up). Let’s not discuss TFS or Subversion – they’re dead except for special use cases. Web development is not a special use case. So, install Git.

Front-End JavaScript Development Libraries

One word: jQuery. Whatever you do, you probably want to include this. A lot of frameworks include this out of the box, but if they don’t you’d still want this. Tons of utility functions, loads of functions for manipulating the DOM and they work as fast as the current browser will allow, without having to worry about what browser you run on. Absolutely essential for fast development.

CSS Framework

To make page layout easier, you can use a library that will give you easy ways of making a page responsive to where it runs and on what media it runs. This might look like an optional choice, but given the amount of different browsers and mobile media nowadays, it is quite impossible to handcode everything for every platform yourself. That’s why choosing one of these frameworks is a must.

The classic package for this was bootstrap.js, but you can also choose foundation.js. They both provide widgets such as buttons, sliders, cards, dropdowns, tabs etcetera but also responsive and columnar layout, and often styling as well. Bootstrap is the most used and best supported library, but Foundation is a strong contender. Currently I will go with Foundation.

Noteworthy is that both options support Google’s new vision on how to design for the new internet, called Material Design. Material Design is a design philosophy that ties the styling for all components you can use on the web together in one design philosophy. Google has changed all its applications over to this design, and also has its own implementation to showcase how this works, called Material Design Lite. This can be used as a lightweight layout framework, but is limited in application and styles. Since it is simple to use and looks very good, however, this is becoming quite popular. You can see it in action on the standard login-screen of Firebase applications that use the default UI. For now, I go with Foundation when I need layout, because Material Design Lite is a bit *too* simple.

Optional tooling

There are also some tools you can live without, but have the potential to make your life a lot easier.

CSS precompiler

A CSS pre-compiler gives you the ability to write CSS in a slightly different language, that gives you smaller CSS that’s easier to understand. If you have just one small stylesheet, you can do without. But once your styles get more complex, a CSS precompiler is very helpful. They provide loops, conditionals, functions for cross-browser compatibility and usually a more readable CSS. Choices here are Less, SASS and Stylus. All can be installed using NPM. Personally, I think Stylus provides the best and cleanest syntax, so I have chosen Stylus.

Task runner

A task runner is software that can take care of the precompiler step, then combines files as needed, minifies them, uglifies them, uploads them to the server and opens and refreshes a browser window. While this can be done with (Gnu)Make or Node Package Manager scripts, it’s easier to do in tools like Grunt and Gulp. Tools like Bower and Webpack also serve slightly different purposes, like combining files into one big JS include, but with HTTP/2 this may actually hurt performance more than it helps. This means there is a whole zoo of task managers and no clear winner in sight.

At the moment I use Gnu Make (from the Cygwin project) to compile stylus files and deploy and run Firebase. NPM Scripting wasn’t powerful enough without serious JavaScript coding, so I can’t recommend it. And yes, what I do could all be done by just starting the tools with the right options, but I find Make easier to use. Should I disover that I need something more powerful, I’ll try that and update this section.

Even more optionally optional tooling

And then we have the section with tools you don’t want or need to install unless you suddenly have a pressing need. And even then you should reconsider this until you have run out of alternatives. For most applications these are overkill. Come back when you are supporting something as complex as Facebook.

JavaScript libraries

jQuery is often combined with Underscore.js or Lodash.js for utility functions. Lodash seems to be faster and more agile. However, I consider it an optional library and you can chose whichever you like.

Another potentially useful library is Immutable.js. This provides you with enforced immutable datastructures, that eliminate accidental side effects from functions, preventing errors and improving performance. However, I don’t use it currently.

Testing Frameworks

Mocha and Chai are frameworks that provide you with the ability to do easy unit and integration testing, with good reporting. However, I’m not developing a library used by dozens of people. And neither is my game in any way going to be mission critical for anyone. So while breaking things while fixing others does look unprofessional, I can live with that for now. My application will likely remain small and easy to bugfix, so I am not going to invest in these frameworks at this time.

Templating Libraries

Templating libraries help us with HTML-templates that we can fill with data. Very useful if you want to display a list, for instance. However, I will skip this subject for now. Mustache.js and Handlebar.js are great libraries for this, but we already have templating in jQuery. If we ever get to a framework like Angular2.js, React.js or Vue.js, things will have to change again anyway. For now, I think jQuery will be fine. For more information, you may want to look into this overview.

JavaScript Frameworks

I haven’t yet discussed the elephant(s) in the room: Angular2.js, React.js and Vue.js. These are very popular frameworks that bring you everything from design to state machines, and the kitchen sink as well. The choice however, can be difficult. I have not yet decided whether to actually use one, because it’s probably overkill for my needs. I do not currently intend to build a Single Page Application. However, it may well turn out to be a better option than building a lot of separate pages. In that case I intend to go with Vue.js. This is because Angular2.js has a Model-View-Controller architecture I don’t think meshes particularly well with my application or Firebase. I’m much happier with a Model-View-ViewController type of architecture with one-way databinding (updates flow from the model to the view, not vice versa). This would mean either React or Vue since both support the Flux architecture with Redux and VueX. React is a bit heavier than Vue and renders the HTML from JavaScript, which is something I’m not particularly fond of, so if it comes down to it, I’ll go with Vue. For now though, I will stick with Foundation and jQuery for layout and templating.

My choices

As this is a journey, I’m going to travel a bit. Currently I have packed the following tools for my journey:

  • Development environment: Node.js (+ Node Package Manager) + Cygwin on windows
  • Language: JavaScript/ES5
  • Text editor: Visual Studio Code
  • Back-end: Firebase
  • Source code control system: Git
  • Front-End JavaScript Library: jQuery
  • CSS pre-compiler: Stylus
  • CSS layout framework: Foundation.js
  • Task runner: Make

That concludes my first post in the journey for now. My second post will detail my setup, including installation and configuration.

How to learn JavaScript

I’ve been busy with JavaScript for some time now – with various degrees of succes – and I thought it would be nice to list a few resources that I found both quite helpful, and accessible.

Highly recommended, but not used by me because I only found out about it after the fact:

Once you know a bit more about JavaScript (or ECMAScript, as it is properly called) you probably want to use it in something interesting. I’ve built a few things with the JavaScript graphics library D3 that give immediate results in just a few lines of code, which is a great motivator.

If you have any suggestions for improvements or additions, feel free to let me know in the comments!

Collatz calculator

By Pokipsy76 - English wikipedia, Public Domain, https://commons.wikimedia.org/w/index.php?curid=7188269

Grundsätzlich IT B.V. would like to publish a small javascript tool: the Collatz Calculator, on the occasion of the publication of a new proof of the Collatz Conjecture.

Two days ago Peter Schorer published a new proof of the famous mathematical problem named the Collatz Conjecture. This doesn’t mean it has been proven, though: new proofs for this particular problem appear with depressing regularity, only to be invalidated in a few weeks. But we can always hope for the best!

The problem itself can be stated in simple terms:

Take any positive integer n.

  • If n is even, divide it by 2 to get n / 2
  • If n is odd, multiply it by 3 and add 1 to obtain 3n + 1

Repeat the process (which has been called “Half Or Triple Plus One”, or HOTPO[7]) indefinitely.

The conjecture is that no matter what number you start with, you will always eventually reach 1. This seems easy to prove, but the Collatz mapping above exhibits chaotic, even fractal behaviour. Thus, a proof has long been sought but not yet been found. Due to the relationship to several other longstanding mathematical problems, this problem has occupied mathematicians for at least a century, possibly much longer than that. Leading to frustration in some quarters.

Used with permission.

To get some idea of the complexities of the mapping, feel free to play with this Collatz Calculator (javascript): Start the Collatz Calculator


A jQuery cheat sheet

jQuery cheat sheet

A few days ago we received an e-mail from Robert Mening at WebsiteSetup.org, who kindly pointed us to his jQuery cheat sheet. There are of course more than a few cheatsheets for jQuery out there, but this one at least has the advantage that it all fits on one page.

 Ronald Kunenborg | march 2017.

The cheat sheet can be found at the bottom of this page. Note that clicking on the image will take you to a webpage where you can also find a PDF-version of the cheat sheet. Alternative cheat sheets can of course be found with a quick search on Google, and from various sources that integrate others (for instance at https://www.sitepoint.com/10-jquery-cheat-sheets/ ). The ones we found most useful though, are the following:

We do have some issues with the cheat sheets in question: there is usually no license on the sheet itself, and the version of jQuery for which it is relevant isn’t always mentioned. These small failings also apply to the cheat sheet shown below. However, if you’re doing some jQuery work now and then, you could do worse than just putting up a copy of the cheat sheet displayed here.

jQuery Cheat Sheet

Image source: websitesetup.org – free to link with attribution

Integrating Twitter in WordPress

twitter large logo

Last year Twitter decided to change the way Twitter interacts with the rest of the world, by making it more difficult to integrate its twitter-streams with your own website. While you can get around this if you can deploy server-side software and go through the hassle of signing up for a developer key, a lot of folks run websites without being interested in having to program just to get their own tweets to display.

Twitter does have a solution, but this just dumps the stream on your site with the lay-out and styling of Twitter. While this is understandable from a branding and marketing point of view, it’s incredibly annoying to have your website look like a hash of different styles just because Twitter doesn’t like you changing the lay-out. So there are a lot of people looking for alternatives.

The best alternative I’ve found for my purpose is http://jasonmayes.com/projects/twitterApi/. Jason Mayes twitter API just takes the formatted twitter-feed, removes the formatting and provides the stream with normal tags to the page. Using standard CSS you can then style the stream and presto, you have a nice looking twitter feed.

How it works in WordPress is as follows:
– Download the software from http://jasonmayes.com/projects/twitterApi/
– Upload the javascript file “twitterFetcher_min.js” to your website. This could be as media but I chose to use FTP to upload it into a theme. As long as it’s on your website it’s okay though, the location is unimportant.
– Add a Text widget to the page where you want the tweets to show up.
– Include the following text in the widget:


<script src="/{path}/twitterFetcher_min.js"></script>
<div id="tweet-element">Tweets by Ronald Kunenborg</div>

<script>
var configProfile = {
"profile": {"screenName": '{yourtwittername}'},
"domId": 'tweet-element',
"maxTweets": 10,
"enableLinks": true,
"showUser": true,
"showTime": true,
"showImages": true
};
twitterFetcher.fetch(configProfile);
</script>

Replace “{yourtwittername}” with your own twitter name (of that of someone whose timeline you wish to show), and the {path} with the path of the uploaded javascript and you’re good to go. However, this looks pants. So we need to style it. In order to do that, include the following text in the widget before the script:
<style>
/*
* Tweet CSS - on Jason Mayes tweetgrabber (http://jasonmayes.com/projects/twitterApi/)
*/

div#tweet-element ul {
list-style: none;
}

div#tweet-element h2 {
clear:both;
}

div#tweet-element p {
font-size: 9pt;
margin: 0 0 0 0;
}

div#tweet-element ul li {
list-style:none;
overflow:hidden;
border-top:1px solid #dedede;
margin: 5px 0 10px 0;
padding: 0px;
}

div#tweet-element ul li:hover {
background-color:#f0f3fb;
}

/* tekst of tweet */
.tweet {
clear: left;
}

.user {
clear:left;
float:left;
}

.user a {
}

/* hide the @twittername, which is the 3rd span in the user class */
.user span:nth-child(3) {
display: none;
}

.user a > span {
margin-left:2px;
}

.user a > span {
display: table-cell;
vertical-align: middle;
margin: 5px;
padding: 5px;
}

.widget-text img,
.user a span img {
display: block;
float:left;
max-width: 40px;
margin: 2px 2px 2px 2px;
}

div#tweet-element p.timePosted {
clear: left;
font-style: italic;
}

div#tweet-element p.timePosted a {
color: #444;
}

.interact {
float:left;
margin-top:-7px;
width: 100%;
}

.interact a {
margin-left: 0px;
margin-right: 5px;
width: 30%;
}

.interact a.twitter_reply_icon {
float:left;
text-align: center;
}

.interact a.twitter_retweet_icon {
float:left;
text-align: center;
}

.interact a.twitter_fav_icon {
float:right;
text-align: center;
}

/* show media on front-page - hide it with display:none if you don't want to show media included by others. */
.media img {
max-width:100%;
}

#linkage {
position:fixed;
top:0px;
right:0px;
background-color:#3d3d3d;
color:#ffffff;
text-decoration:none;
padding:5px;
width:10%;
font-family:arial;
}
</style>

Make sure the <style> part is first in the Text widget.

Of course you can also put the style (without the <style> tags) in a stylesheet (.css) file, upload it and then refer to it, instead of pasting the stylesheet in the Text widget. In that case use the following command:

<link rel='stylesheet' id='twitter-css' href='/{path}/twitter-style.css' type='text/css' media='all' />

And please replace {path} with the desired path.

I hope this helps you as much as it helped me.

Creating brilliant visualizations of graph data with D3 and Neo4j

Okay, so someone recommended I spice up the titles a bit. I hope you’re happy now!

Anyway, it really is the truth: you can create brilliant visualizations of data with the D3 javascript library, and when you combine it with Neo4j and the REST API that gives you acccess to its data, you can create brilliant visualizations of graph data.

Examples of d3 visualizations

Examples of d3 visualizations, laid out in a hexadecimal grid

So what’s D3? Basically, D3 is a library that enables a programmer to construct and manipulate the DOM (Document Object Model) in your webbrowser. The DOM is what lives in the memory of your computer once a webpage has been read from the server and parsed by your browser. If you change anything in the DOM, it will be reflected on the webpage immediately.

There are more libraries that can manipulate the DOM (such as JQuery), but D3 is focused towards ease of use when using data as the driver for such manipulations, instead of having code based on mouseclicks do some alterations. There are commands to read CSV or other formats, parse them and then feed them to further commands that tell D3 how to change the DOM based on the data. This focus on using data to drive the shape of the DOM is gives D3.js its name: Data Driven Documents.

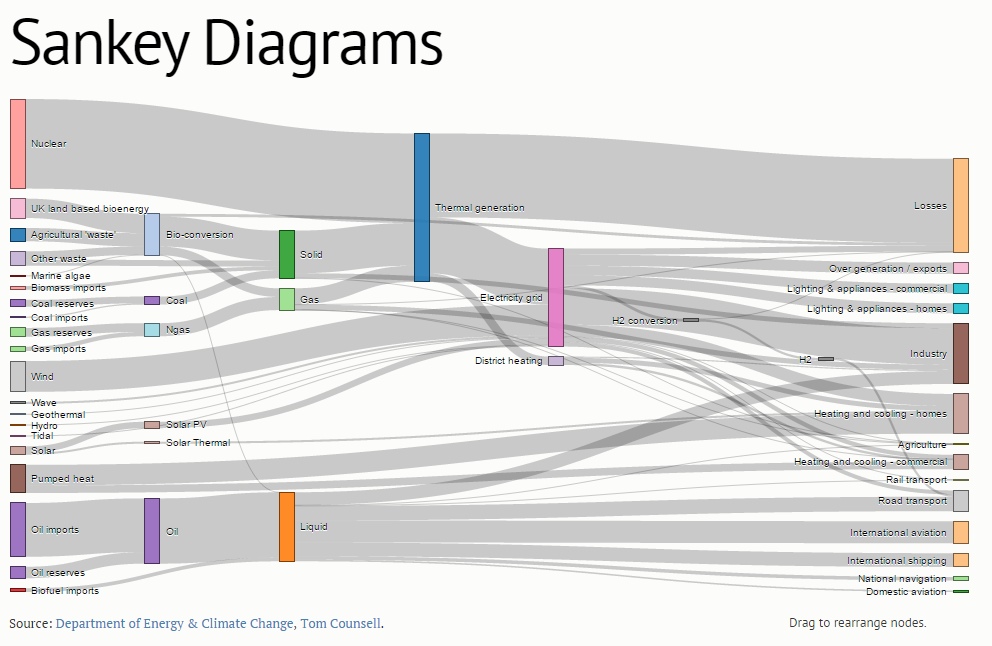
An example of what you can achieve with minimal coding is for instance the Neo4j browser itself, and the force-connected network that is shown as the output for a query returning nodes and/or relationships. However, another visualization of a network of nodes and relationships is the Sankey diagram:

An example of a Sankey diagram

An example of a Sankey diagram

The Sankey diagram as shown above was created using d3.js, a Sankey plug-in (javascript) and the lines of code that control d3: about 70 lines of Javascript in all.

To demonstrate how easy it is to use d3.js and Neo4j as database to create a nice visualization, I’m not going to use the Sankey example, however. It’s too complex to use as an example for that, although I will write an article about that particular topic in the near future.

No, we’re going to create a bar chart. We’ll use the previous article Using Neo4j CYPHER queries through the REST API as a basis on which to build upon.

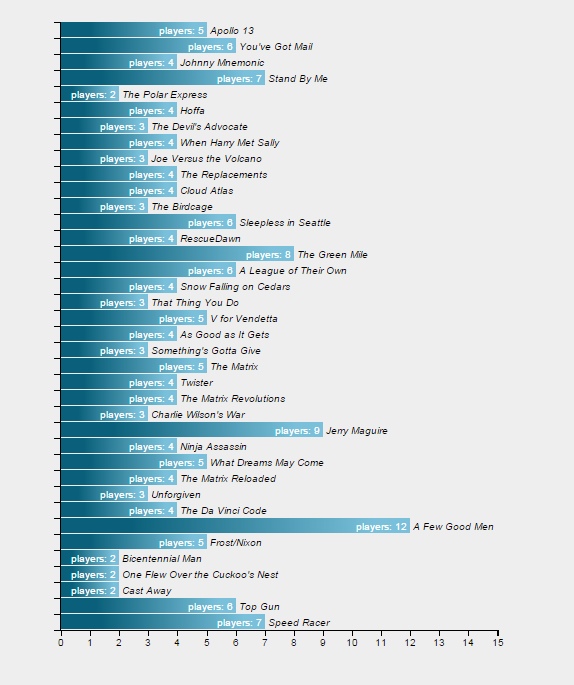
The bar chart, when done, will look like this:

Barchart showing the number of players per movie

Barchart showing the number of players per movie

You will need some understanding of JavaScript (ECMAscript), but this can be obtained easily by reading the quite good book, Eloquent Javascript.

You will also need to understand at least some of the basics of D3, or this article will be incomprehensible. You can obtain such understanding from d3js.org, and I recommend this tutorial (building a bar chart) that goes into much more detail than I do here. An even better introduction is the book “D3 tips and tricks” that starts to build a graph from the ground up, explaining everything while it’s done.

Please note that I used the d3.js library while developing, and it ran fine from the development server. However, when I used d3 with the standard Microsoft webserver, it mangled the Greek alphabet soup in the code and it didn’t work. The minified version (d3.min.js) does not have that issue, so if you run into it, just use the minified version.

We will use nearly the same code as in the previous article, but with a few changes.

First, we add a new include: the D3 library needs to be included. We use the minified version here.

<html>
<head>
<title>Brilliant visualization of graph data with D3 and Neo4j</title>
<script src="scripts/jquery-2.1.3.js"></script>
<script src="scripts/d3.min.js"></script>
</head>
<body>

Next, we add the function “post_cypherquery()” again, to retrieve data from Neo4j. We use exactly the same routine we used the last time.

    <script type="text/javascript">
        function post_cypherquery() {
            // while busy, show we're doing something in the messageArea.
            $('#messageArea').html('<h3>(loading)</h3>');

            // get the data from neo4j
            $.ajax({
                url: "http://localhost:7474/db/data/transaction/commit",
                type: 'POST',
                data: JSON.stringify({ "statements": [{ "statement": $('#cypher-in').val() }] }),                
                contentType: 'application/json',
                accept: 'application/json; charset=UTF-8',
                success: function () { },
                error: function (jqXHR, textStatus, errorThrown) { $('#messageArea').html('<h3>' + textStatus + ' : ' + errorThrown + '</h3>') },
                complete: function () { }
            }).then(function (data) {

Once we have obtained the data, we display the query we used to obtain the result, and clear the “(Loading)” message.

                $('#outputArea').html("<p>Query: '"+ $('#cypher-in').val() +"'</p>");
                $('#messageArea').html('');

Then, we create an empty array to hold the attribute-value pairs we want and push the rows from the resultset into the d3 array. Basically, we make a copy of the resultset in a more practical form.

                var d3_data = [];
                $.each(data.results[0].data, function (k, v) { d3_data.push(v.row); });

Then we determine how big our chart should be. We will be using Mike Bostocks margin convention for this.

We create a barchart that has a margin of 40 pixels on top and bottom, and 200 pixels on the right – because I want to add the movienames on that side of the chart. Our graphic will occupy half the display, so the real area we can draw in is half the window size, minus the horizontal margin. The height of the graph will be scaled to 3/4 of the height of the window, minus the margins. We scale the bars to fit in that size.

                var margin = { top: 40, right: 200, bottom: 40, left: 40 },
                    width = ($(window).width()/2) - margin.left - margin.right,
                    height = ($(window).height()/2) - margin.top - margin.bottom, 
                    barHeight = height / d3_data.length;

Here we use our very first D3 function: d3.max. It will run over the d3_data array and apply our selector function to each element, then find the maximum value of the set.

This will give us the highest amount of players on any movie. Then we add a bit of margin to that so our barchart will look nicer later on, when we use this value to drive the size of the bars in the chart.

                var maxrange = d3.max(d3_data, function (d) { return d[1]; }) + 3;

Next, we use an important part of the D3 library: scales. Scales are used everywhere. Basically, they transform a range of values into another range. You can have all kinds of scales, logarithmic, exponential, etcetera, but we will stick to a linear scale for now. We will use one scale to transform the number of players into a size of the bar (scale_x), and another to transform the position of a movie in the array into a position on the barchart (scale_y).

We use rangeRound at the end, instead of range, to make sure our values are rounded to integers. Otherwise our axis ticks will be on fractional pixels and D3 will anti-alias them, creating very fuzzy axis tickmarks.

                var scale_x = d3.scale.linear()
                    .domain([0, maxrange])
                    .rangeRound([0, width]);

                var scale_y = d3.scale.linear()
                    .domain([d3_data.length, 0])
                    .rangeRound([0, height]);

And once we have the scales, we define our axes. Note that this doesn’t “draw” anything, we’re just defining functions here that tell D3 what they are like. An axis is defined by its scale, the number of ticks we want to see on the axis, and the orientation of the tickmarks.

                var xAxis = d3.svg.axis()
                    .scale(scale_x)
                    .ticks(maxrange)
                    .orient("bottom");

                var yAxis = d3.svg.axis()
                    .scale(scale_y)
                    .ticks(d3_data.length)
                    .orient("left");      

So far, we’ve just loaded our data, and defined the graph area we will use. Now, we’ll start to manipulate the Document Object Model to add tags where we need them. We will start with the most important one: the SVG tag. SVG stands for Scalable Vector Graphics, and it’s a web standard that allows us to draw in the browser page, inside the area defined by this tag. And that is what we will do now, inside the already existing element with id = “outputArea”. This allows us to place the graphics right where we want them to be on the page.

The preserveAspectRatio attribute defines how the chart will behave when the area is resized. See the definition of PreserveAspectRatioAttribute for more information.

                var chart = d3.select("#outputArea")
                    .append("svg")
                    .attr("width", (width + margin.left + margin.right) + "px")
                    .attr("height", (height + margin.top + margin.bottom) + "px")
                    .attr("version", "1.1") 
                    .attr("preserveAspectRatio", "xMidYMid")
                    .attr("xmlns", "http://www.w3.org/2000/svg");

Note that we assign this manipulation to a variable. This variable will hold the position in the DOM where the tag “svg” is placed and we can just add to it, to add more tags.

The first svg element in the svg should have a title and a description, as per the standard. So that is what we will do. After the <svg> tag, we will append a <title> tag with a text.

                chart.append("title")
                    .text("Number of players per movie");

                chart.append("desc")
                    .text("This SVG is a demonstration of the power of Neo4j combined with d3.js.");

Now, we will place a grouping element inside the svg tag. This element < g > will be placed at the correct margin offsets, so anything inside it has the correct margins on the left- and top sides.

                chart = chart.append("g")
                    .attr("transform", "translate(" + (+margin.left) + "," + (+margin.top) + ")");

Now we place the x- and y-axis that we defined earlier on, in the chart. That definition was a function – and now we come CALLing. Here we will also add a class-attribute, that will later allow us to style the x and y-axis separately. We put the x-axis on the bottom of the graph, and the y-axis on the left side.

Since the axes are composed of many svg-elements, it makes sense to define them inside a group-element, to make sure the entire axis and all its elements will be moved to the same location.

Please note that the SVG-coordinates have the (0,0) point at the top left of the svg area.

                chart.append("g")
                    .attr("class", "x axis")
                    .attr("transform", "translate(0," + (+height) + ")")
                    .call(xAxis);
                chart.append("g")
                    .attr("class", "y axis")
                    .attr("transform", "translate(" + (-1) + ",0)")
                    .call(yAxis);

Finally, we get to the point where we add the bars in the chart. Now, this looks strange. Because what happens is that we define a placeholder element in the SVG for every data element, and then D3 will walk over the data elements and call all of the functions after the “data” statement for each data-element.

So everything after the data-statement will be called for EACH element. And if it is a new data-element that wasn’t yet part of the DOM, it will be added to it. And all of the statements that manipulate the DOM, will be called for it.

So, we define the bar as an SVG-group, with a certain class (“bar”) and a position, that is based on the position in the array of elements. We just display the elements ordered in the way we received them. So adding an ORDER BY statement to the CYPHER query will change the order of the bars in the chart.

                var bar = chart.selectAll("g.bar")
                    .data(d3_data)
                    .enter().append("g").attr("class","bar")
                    .attr("transform", function (d, i) { return "translate(0," + i * barHeight + ")"; });

Then, still working with the bar itself, we define a rectangle of a certain width and height. We add the text “players: ” to it, for display inside the rectangle. We define the text as having class “info”. Then, we add the text with the name of the movie for display on the right of the bar, and give it class “movie”. And that concludes our D3 script.

                bar.append("rect")
                    .attr("width", function (d) { return scale_x(d[1]) + "px"; }) 
                    .attr("height", (barHeight - 1) + "px" );

                bar.append("text")
                    .attr("class", "info")
                    .attr("x", function (d) { return (scale_x(d[1]) - 3) + "px"; })
                    .attr("y", (barHeight / 2) + "px")
                    .attr("dy", ".35em")
                    .text(function (d) { return 'players: ' + d[1]; });

                bar.append("text")
                    .attr("class","movie")
                    .attr("x", function (d) { return (scale_x(d[1]) + 3) + "px"; })
                    .attr("y", (barHeight / 2) + "px")
                    .attr("dy", ".35em")
                    .text(function (d) { return d[0]; });
            });
        };
    </script>

All that remains is to define the HTML of the page itself that will display at first. This is the same HTML as before, but with a different CYPHER query.

<h1>Cypher-test</h1>
<p>
<div id="messageArea"></div>
<p>
<table>
  <tr>
    <td><input name="cypher" id="cypher-in" value="MATCH (n:Movie)-[:ACTED_IN]-(p:Person) return n.title as movietitle, count(p) as players" /></td>
    <td><button name="post cypher" onclick="post_cypherquery();">execute</button></td>
  </tr>
</table>
<p>
<div id="outputArea"></div>
<p>
</body>
</html>

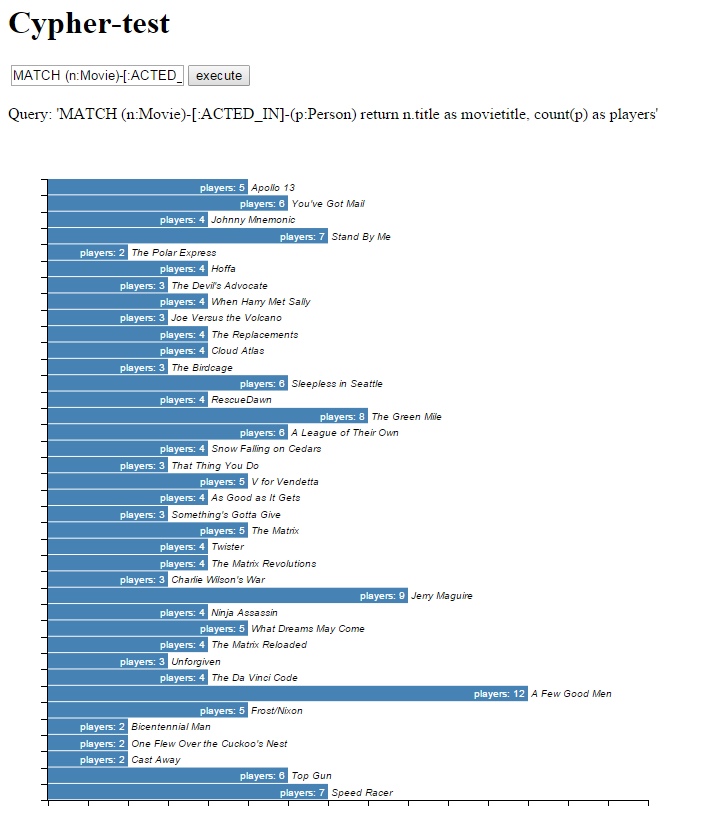
Unfortunately, at this point our barchart will look like this:

Unstyled d3 barchart in black and white with blocky axes

Unstyled d3 barchart

What happened was that we didn’t use ANY styling at all. That doesn’t look very nice, so we will add a stylesheet to the page. Note that you can style SVG-elements just as you can style standard HTML elements, but there is one caveat: the properties are different. Where you can use the color attribute (style="color:red") on an HTML element, you would have to use the stroke and fill attributes for SVG elements. Just the text element alone has a lot of options, as shown in this tutorial.

So, we now add a stylesheet at the end of the <head> section. We start with the definitions of the bars – they will be steelblue rectangles with white text. The standard text will be white, right-adjusted text that stands to the left of the starting point. The movie-text will be left-adjusted and stand to the right of its starting position, in italic black font.

<style>
#outputArea {
  height: 50px;
}

#outputArea rect {
  fill: steelblue; 
}

#outputArea text {
  fill: white;
  font: 10px sans-serif;
  text-anchor: end;
  color: white;
}

#outputArea text.movie {
  fill: black;
  font: 10px sans-serif;
  font-style: italic;
  text-anchor: start;
}

Now we define the axes. They will be rendered with very small lines (crispEdges), in black. The minor tickmarks will be less visible than the normal tickmarks.

.axis {
  shape-rendering: crispEdges;
  stroke: black;
}

.axis text {
  stroke: none;
  fill: black;
  font: 10px sans-serif;
}

.y.axis text {
  display: none;
}

.x.axis path,
.x.axis line,
.y.axis path,
.y.axis line {
  fill: none;
  stroke: black;
  stroke-width: 1px;
  shape-rendering: crispEdges;
}

.x.axis .minor,
.y.axis .minor {
  stroke-opacity: .5;
}
</style>

And now, we get this:

Styled d3 barchart in color with crisp axes

Styled d3 barchart

We can add more bells and whistles, such as animations and nice gradients for the bars, but that’s something I’ll leave to you.

By the way: we can add SVG elements, but in the same manner we could also just add plain HTML elements and create a nicely styled tabular lay-out for the same data. Or we could create a Sankey diagram. But that’s something for another post.

Using Neo4j CYPHER queries through the REST API

Lately I have been busy with graph databases. After reading the free eBook “Graph Databases” I installed Neo4j and played around with it. Later I went as far as to follow the introduction course as well as the advanced graph modeling course at Xebia. This really helped me start playing around with Neo4j in a bit more structured manner than I was doing before the course.

I can recommend installing Neo4j and just starting to use it, as it has a great user interface with excellent help manuals. For instance, this is the startscreen:

Neo4j-startscreen

Easy, right?

One of the things that struck me was the ease with which you could access the data from ECMAscript (or Javascript if you’re very old and soon-to-be obsoleted). Using the REST API you can access the graph in several ways, reading and writing data from and to the database. It’s the standard interface, actually. There’s a whole section in the Neo4j help dedicated to using the REST API, so I’ll leave most of it alone for now.

What’s important, is that you can also fire CYPHER queries at the database, receiving an answer in either JSON or XML notation, or even as an HTML page. This is important because CYPHER queries are *very* easy to write and understand. As an example, the following query will search the sample database that is part of the Neo4j database, with Movies and Actors.

Suppose we want to show all nodes that are of type Movie. Then the statement would be:

MATCH (m:Movie) RETURN m

A standard query to discover what’s in the database is
MATCH (m) RETURN m LIMIT 100
This is limited to 100 items (nodes and/or relationships), because it does return the entire database otherwise and in the user interface this starts to slow things down. It’s gorgeous, but when your resultsets are getting big it does slow things down. Here’s how it looks:

Neo4j-results-1

Very nice. But not that useful if we want a particular piece of data. However, if we want to show only the actors that played in movies, we could say:

MATCH (p:Person)-[n:ACTED_IN]->(m:Movie) RETURN p

This returns all nodes of type Person that are related to a node of type Movie through an edge of type ACTED_IN.

While I won’t go into more detail on Cypher, let’s just say it is a very powerful abstraction layer for queries on graphs that would be very hard to do with SQL. It’s not as performant as actually giving Neo4J explicit commands using the REST API, which you want to do if you build an application where sub-second performance is an issue, but for most day-to-day queries it’s pretty awesome.

So how do we use the REST API? That’s pretty easy, actually. There are two options, and one of them is now deprecated – that is the old CYPHER endpoint. So we use the new http://localhost:7474/db/data/transaction/commit endpoint, which starts a transaction and immediately commits it. And yes, you can delete and create nodes through this endpoint as well so it’s highly recommended to not expose the database to the internet, unless you don’t mind everyone using your server as a public litterbox.

You have to POST requests to the endpoint. There are endpoints you can access with GET, like http://localhost:7474/db/data/node/1 which returns the node with id=1 on a HTML page, but the transactional endpoint is accessed using POST.

The easiest way to use a REST API is to start a simple webserver, create a simple HTML-page, add Javascript to it that responds to user input and that calls the Neo4j REST API.

Since we’re going to use Javascript, be smart and use JQuery as well. It’s pretty much a standard include.

How to proceed:

  • First, start the Neo4j software. This opens a screen where you can start the database server, and in the bottom left of the screen you can see a button labeled “Options…”. Click that, then click the “Edit…” button in the Server Configuration section. Disable authentication for now (and make very sure you don’t do this on a server connected to the internet) by changing the code to the following:

    # Require (or disable the requirement of) auth to access Neo4j
    dbms.security.auth_enabled=false

    This makes sure we don’t have the hassle of authentication for now. Don’t do this on a connected server though.

  • Now, we start the Neo4j database. Otherwise we get strange errors.
  • Then, proceed to build a new HTML-page (I suggest index.html) on your webserver, that looks like this:
    <html>
    <head>
    <title>Cypher-test</title>
    <script src="scripts/jquery-2.1.3.js"></script>
    </head>
    <body>
        <script type="text/javascript">
            function post_cypherquery() {
                $('#messageArea').html('<h3>(loading)</h3>');
    
                $.ajax({
                    url: "http://localhost:7474/db/data/transaction/commit",
                    type: 'POST',
                    data: JSON.stringify({ "statements": [{ "statement": $('#cypher-in').val() }] }),
                    contentType: 'application/json',
                    accept: 'application/json; charset=UTF-8'                
                }).done(function (data) {
                    $('#resultsArea').text(JSON.stringify(data));
                    /* process data */
                    // Data contains the entire resultset. Each separate record is a data.value item, containing the key/value pairs.
                    var htmlString = '<table><tr><td>Columns:</td><td>' + data.results[0].columns + '</td></tr>';
                    $.each(data.results[0].data, function (k, v) {
                        $.each(v.row, function (k2, v2) {
                            htmlString += '<tr>';
                            $.each(v2, function (property, nodeval) {
                                htmlString += '<td>' + property + ':</td><td>' + nodeval + '</td>';
                            });
                            htmlString += '</tr>';
                        });
                    });
                    $('#outputArea').html(htmlString + '</table>');
                })
                .fail(function (jqXHR, textStatus, errorThrown) {
                    $('#messageArea').html('<h3>' + textStatus + ' : ' + errorThrown + '</h3>')
                });
            };
        </script>
    
    <h1>Cypher-test</h1>
    <p>
    <div id="messageArea"></div>
    <p>
    <table>
      <tr>
        <td><input name="cypher" id="cypher-in" value="MATCH (n) RETURN n LIMIT 10" /></td>
        <td><button name="post cypher" onclick="post_cypherquery();">execute</button></td>
      </tr>
    </table>
    <p>
    <div id="outputArea"></div>
    <p>
    </body>
    </html>
    

    Make sure you don’t forget to download JQuery and put the downloaded file in the scripts subdirectory below the directory in which you place this file. The line where you need to change the corresponding filename if you rename the file or place it somewhere else is highlighted in red.

While this doesn’t look very pretty, it gets the job done. It executes an AJAX call to Neo4j, using the transactional endpoint. After receiving a success-response, it writes the raw answer (JSON) into the resultsArea over the input box. Then, it parses the result and writes the results to a table in the dataArea.

The resultset from neo4j is returned as a data-object that looks like this:

{
  "results" : [ {
    "columns" : [ "n" ],
    "data" : [ 
      {"row" : [{"name":"Leslie Zemeckis"}]}, 
      {"row" : [{"title":"The Matrix","released":1999,"tagline":"Welcome to the Real World"}]}, 
      {"row" : [{"name":"Keanu Reeves","born":1964}]} 
      ]
  } ],
  "errors" : [ ]
}

Note the different row-variants. Since we did not limit ourselves to a single type of node, we got both Movie- and Actor-nodes in the result. And even within a single node-type, not every node has the same properties. The neo4j manual has more information about the possible contents of the resultset.

Please note that ANY valid Cypher-statement will be executed, including CREATE and DELETE statements, so feel free to play around with this.

– Ronald Kunenborg.