Okay, so someone recommended I spice up the titles a bit. I hope you’re happy now!
Anyway, it really is the truth: you can create brilliant visualizations of data with the D3 javascript library, and when you combine it with Neo4j and the REST API that gives you acccess to its data, you can create brilliant visualizations of graph data.

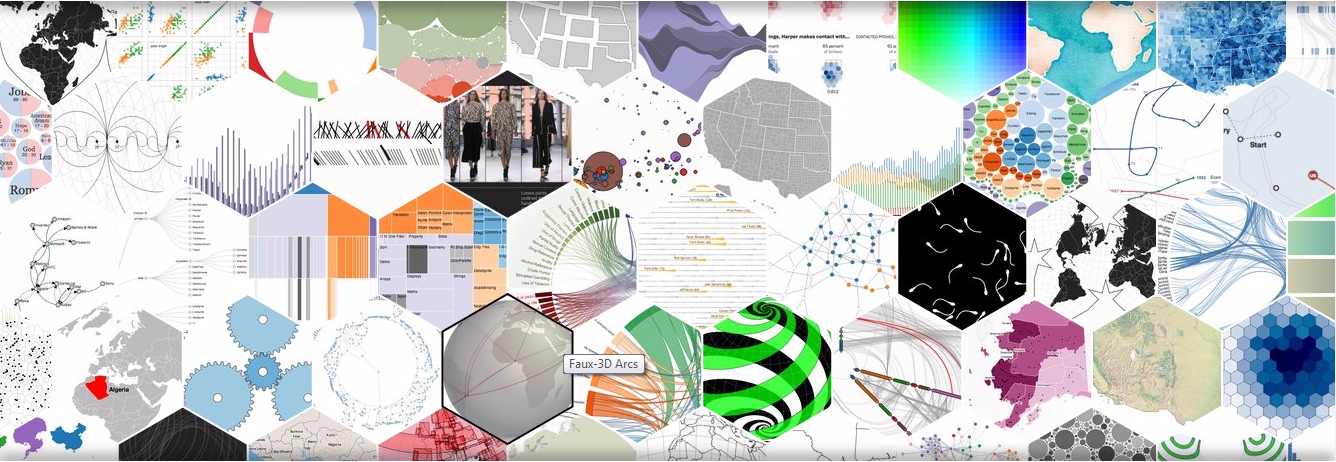
Examples of d3 visualizations, laid out in a hexadecimal grid
So what’s D3? Basically, D3 is a library that enables a programmer to construct and manipulate the DOM (Document Object Model) in your webbrowser. The DOM is what lives in the memory of your computer once a webpage has been read from the server and parsed by your browser. If you change anything in the DOM, it will be reflected on the webpage immediately.
There are more libraries that can manipulate the DOM (such as JQuery), but D3 is focused towards ease of use when using data as the driver for such manipulations, instead of having code based on mouseclicks do some alterations. There are commands to read CSV or other formats, parse them and then feed them to further commands that tell D3 how to change the DOM based on the data. This focus on using data to drive the shape of the DOM is gives D3.js its name: Data Driven Documents.
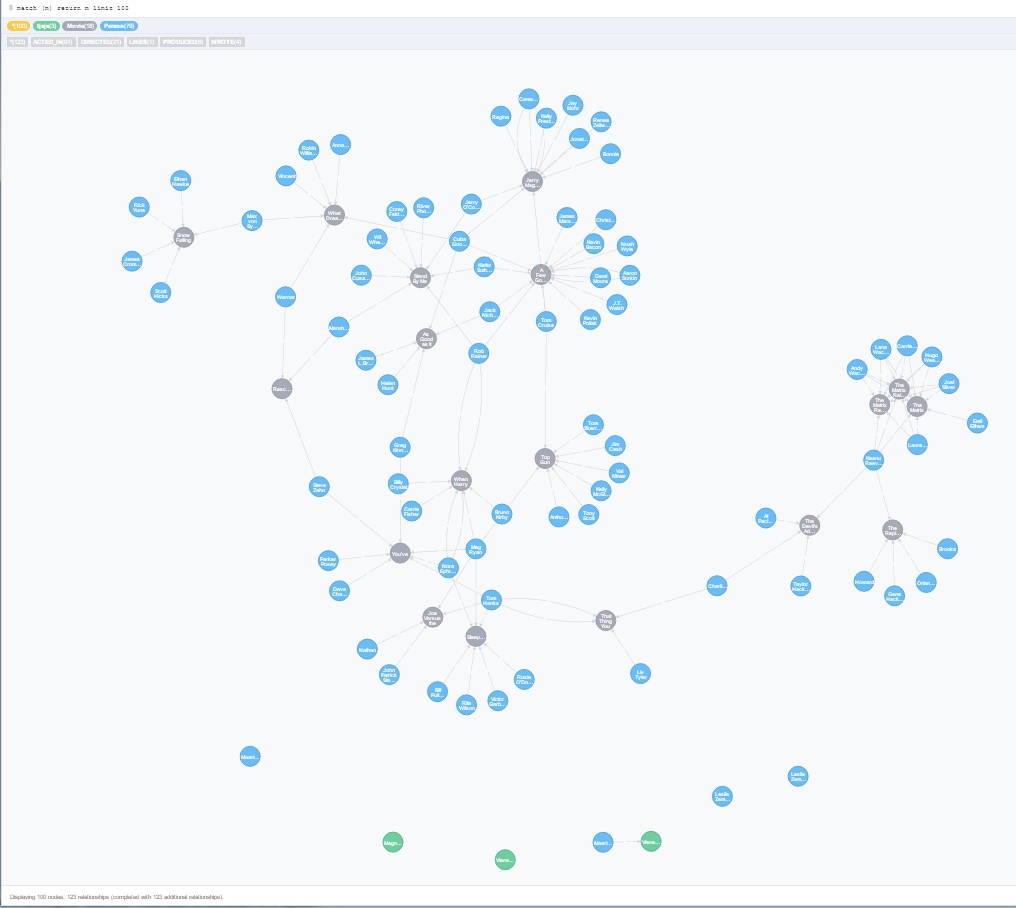
An example of what you can achieve with minimal coding is for instance the Neo4j browser itself, and the force-connected network that is shown as the output for a query returning nodes and/or relationships. However, another visualization of a network of nodes and relationships is the Sankey diagram:
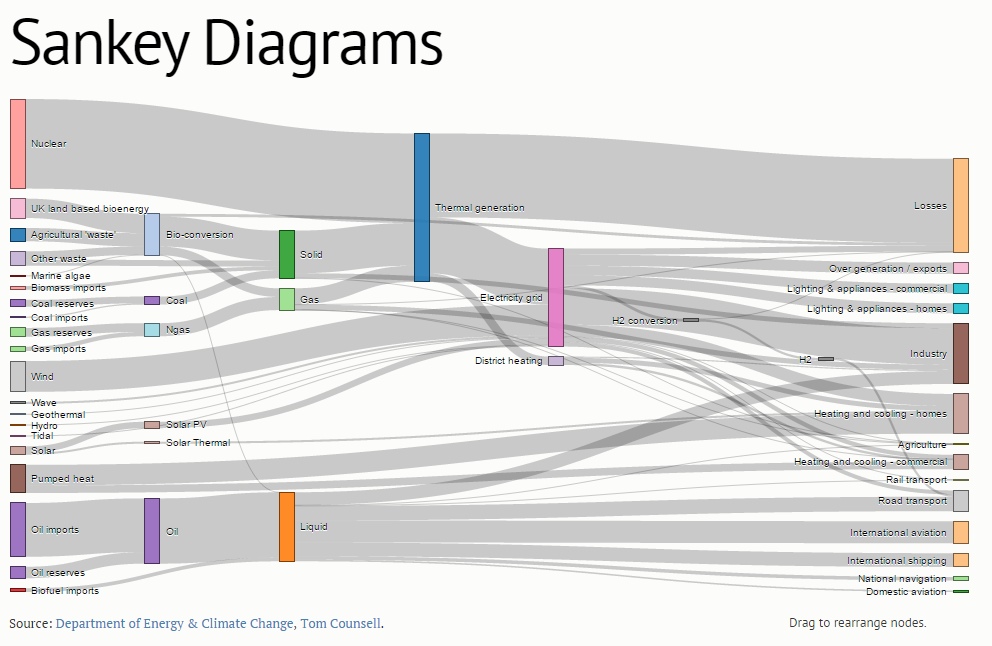
An example of a Sankey diagram
The Sankey diagram as shown above was created using d3.js, a Sankey plug-in (javascript) and the lines of code that control d3: about 70 lines of Javascript in all.
To demonstrate how easy it is to use d3.js and Neo4j as database to create a nice visualization, I’m not going to use the Sankey example, however. It’s too complex to use as an example for that, although I will write an article about that particular topic in the near future.
No, we’re going to create a bar chart. We’ll use the previous article Using Neo4j CYPHER queries through the REST API as a basis on which to build upon.
The bar chart, when done, will look like this:
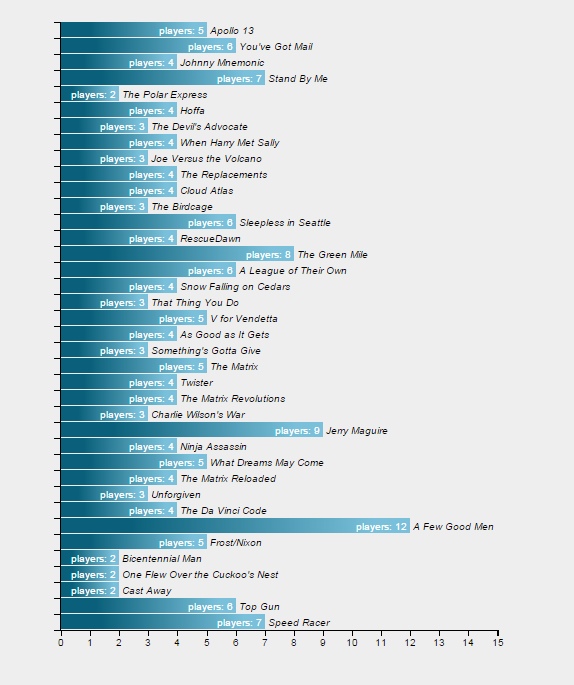
Barchart showing the number of players per movie
You will need some understanding of JavaScript (ECMAscript), but this can be obtained easily by reading the quite good book, Eloquent Javascript.
You will also need to understand at least some of the basics of D3, or this article will be incomprehensible. You can obtain such understanding from d3js.org, and I recommend this tutorial (building a bar chart) that goes into much more detail than I do here. An even better introduction is the book “D3 tips and tricks” that starts to build a graph from the ground up, explaining everything while it’s done.
Please note that I used the d3.js library while developing, and it ran fine from the development server. However, when I used d3 with the standard Microsoft webserver, it mangled the Greek alphabet soup in the code and it didn’t work. The minified version (d3.min.js) does not have that issue, so if you run into it, just use the minified version.
We will use nearly the same code as in the previous article, but with a few changes.
First, we add a new include: the D3 library needs to be included. We use the minified version here.
<html>
<head>
<title>Brilliant visualization of graph data with D3 and Neo4j</title>
<script src="scripts/jquery-2.1.3.js"></script>
<script src="scripts/d3.min.js"></script>
</head>
<body>
Next, we add the function “post_cypherquery()” again, to retrieve data from Neo4j. We use exactly the same routine we used the last time.
    <script type="text/javascript">
        function post_cypherquery() {
            // while busy, show we're doing something in the messageArea.
            $('#messageArea').html('<h3>(loading)</h3>');

            // get the data from neo4j
            $.ajax({
                url: "http://localhost:7474/db/data/transaction/commit",
                type: 'POST',
                data: JSON.stringify({ "statements": [{ "statement": $('#cypher-in').val() }] }),
                contentType: 'application/json',
                accept: 'application/json; charset=UTF-8',
                success: function () { },
                error: function (jqXHR, textStatus, errorThrown) { $('#messageArea').html('<h3>' + textStatus + ' : ' + errorThrown + '</h3>') },
                complete: function () { }
            }).then(function (data) {
Once we have obtained the data, we display the query we used to obtain the result, and clear the “(Loading)” message.
                $('#outputArea').html("<p>Query: '"+ $('#cypher-in').val() +"'</p>");
                $('#messageArea').html('');
Then, we create an empty array to hold the attribute-value pairs we want and push the rows from the resultset into the d3 array. Basically, we make a copy of the resultset in a more practical form.
                var d3_data = [];
                $.each(data.results[0].data, function (k, v) { d3_data.push(v.row); });
Then we determine how big our chart should be. We will be using Mike Bostocks margin convention for this.
We create a barchart that has a margin of 40 pixels on top and bottom, and 200 pixels on the right – because I want to add the movienames on that side of the chart. Our graphic will occupy half the display, so the real area we can draw in is half the window size, minus the horizontal margin. The height of the graph will be scaled to 3/4 of the height of the window, minus the margins. We scale the bars to fit in that size.
                var margin = { top: 40, right: 200, bottom: 40, left: 40 },
                    width = ($(window).width()/2) - margin.left - margin.right,
                    height = ($(window).height()/2) - margin.top - margin.bottom,
                    barHeight = height / d3_data.length;
Here we use our very first D3 function: d3.max. It will run over the d3_data array and apply our selector function to each element, then find the maximum value of the set.
This will give us the highest amount of players on any movie. Then we add a bit of margin to that so our barchart will look nicer later on, when we use this value to drive the size of the bars in the chart.
var maxrange = d3.max(d3_data, function (d) { return d[1]; }) + 3;
Next, we use an important part of the D3 library: scales. Scales are used everywhere. Basically, they transform a range of values into another range. You can have all kinds of scales, logarithmic, exponential, etcetera, but we will stick to a linear scale for now. We will use one scale to transform the number of players into a size of the bar (scale_x), and another to transform the position of a movie in the array into a position on the barchart (scale_y).
We use rangeRound at the end, instead of range, to make sure our values are rounded to integers. Otherwise our axis ticks will be on fractional pixels and D3 will anti-alias them, creating very fuzzy axis tickmarks.
                var scale_x = d3.scale.linear()
                    .domain([0, maxrange])
                    .rangeRound([0, width]);

                var scale_y = d3.scale.linear()
                    .domain([d3_data.length, 0])
                    .rangeRound([0, height]);
And once we have the scales, we define our axes. Note that this doesn’t “draw” anything, we’re just defining functions here that tell D3 what they are like. An axis is defined by its scale, the number of ticks we want to see on the axis, and the orientation of the tickmarks.
                var xAxis = d3.svg.axis()
                    .scale(scale_x)
                    .ticks(maxrange)
                    .orient("bottom");

                var yAxis = d3.svg.axis()
                    .scale(scale_y)
                    .ticks(d3_data.length)
                    .orient("left");
So far, we’ve just loaded our data, and defined the graph area we will use. Now, we’ll start to manipulate the Document Object Model to add tags where we need them. We will start with the most important one: the SVG tag. SVG stands for Scalable Vector Graphics, and it’s a web standard that allows us to draw in the browser page, inside the area defined by this tag. And that is what we will do now, inside the already existing element with id = “outputArea”. This allows us to place the graphics right where we want them to be on the page.
The preserveAspectRatio attribute defines how the chart will behave when the area is resized. See the definition of PreserveAspectRatioAttribute for more information.
                var chart = d3.select("#outputArea")
                    .append("svg")
                    .attr("width", (width + margin.left + margin.right) + "px")
                    .attr("height", (height + margin.top + margin.bottom) + "px")
                    .attr("version", "1.1")
                    .attr("preserveAspectRatio", "xMidYMid")
                    .attr("xmlns", "http://www.w3.org/2000/svg");
Note that we assign this manipulation to a variable. This variable will hold the position in the DOM where the tag “svg” is placed and we can just add to it, to add more tags.
The first svg element in the svg should have a title and a description, as per the standard. So that is what we will do. After the <svg> tag, we will append a <title> tag with a text.
                chart.append("title")
                    .text("Number of players per movie");

                chart.append("desc")
                    .text("This SVG is a demonstration of the power of Neo4j combined with d3.js.");
Now, we will place a grouping element inside the svg tag. This element < g > will be placed at the correct margin offsets, so anything inside it has the correct margins on the left- and top sides.
                chart = chart.append("g")
                    .attr("transform", "translate(" + (+margin.left) + "," + (+margin.top) + ")");
Now we place the x- and y-axis that we defined earlier on, in the chart. That definition was a function – and now we come CALLing. Here we will also add a class-attribute, that will later allow us to style the x and y-axis separately. We put the x-axis on the bottom of the graph, and the y-axis on the left side.
Since the axes are composed of many svg-elements, it makes sense to define them inside a group-element, to make sure the entire axis and all its elements will be moved to the same location.
Please note that the SVG-coordinates have the (0,0) point at the top left of the svg area.
                chart.append("g")
                    .attr("class", "x axis")
                    .attr("transform", "translate(0," + (+height) + ")")
                    .call(xAxis);
                chart.append("g")
                    .attr("class", "y axis")
                    .attr("transform", "translate(" + (-1) + ",0)")
                    .call(yAxis);
Finally, we get to the point where we add the bars in the chart. Now, this looks strange. Because what happens is that we define a placeholder element in the SVG for every data element, and then D3 will walk over the data elements and call all of the functions after the “data” statement for each data-element.
So everything after the data-statement will be called for EACH element. And if it is a new data-element that wasn’t yet part of the DOM, it will be added to it. And all of the statements that manipulate the DOM, will be called for it.
So, we define the bar as an SVG-group, with a certain class (“bar”) and a position, that is based on the position in the array of elements. We just display the elements ordered in the way we received them. So adding an ORDER BY statement to the CYPHER query will change the order of the bars in the chart.
                var bar = chart.selectAll("g.bar")
                    .data(d3_data)
                    .enter().append("g").attr("class","bar")
                    .attr("transform", function (d, i) { return "translate(0," + i * barHeight + ")"; });
Then, still working with the bar itself, we define a rectangle of a certain width and height. We add the text “players: ” to it, for display inside the rectangle. We define the text as having class “info”. Then, we add the text with the name of the movie for display on the right of the bar, and give it class “movie”. And that concludes our D3 script.
                bar.append("rect")
                    .attr("width", function (d) { return scale_x(d[1]) + "px"; })
                    .attr("height", (barHeight - 1) + "px" );

                bar.append("text")
                    .attr("class", "info")
                    .attr("x", function (d) { return (scale_x(d[1]) - 3) + "px"; })
                    .attr("y", (barHeight / 2) + "px")
                    .attr("dy", ".35em")
                    .text(function (d) { return 'players: ' + d[1]; });

                bar.append("text")
                    .attr("class","movie")
                    .attr("x", function (d) { return (scale_x(d[1]) + 3) + "px"; })
                    .attr("y", (barHeight / 2) + "px")
                    .attr("dy", ".35em")
                    .text(function (d) { return d[0]; });
            });
        };
    </script>
All that remains is to define the HTML of the page itself that will display at first. This is the same HTML as before, but with a different CYPHER query.
<h1>Cypher-test</h1>
<p>
<div id="messageArea"></div>
<p>
<table>
  <tr>
    <td><input name="cypher" id="cypher-in" value="MATCH (n:Movie)-[:ACTED_IN]-(p:Person) return n.title as movietitle, count(p) as players" /></td>
    <td><button name="post cypher" onclick="post_cypherquery();">execute</button></td>
  </tr>
</table>
<p>
<div id="outputArea"></div>
<p>
</body>
</html>
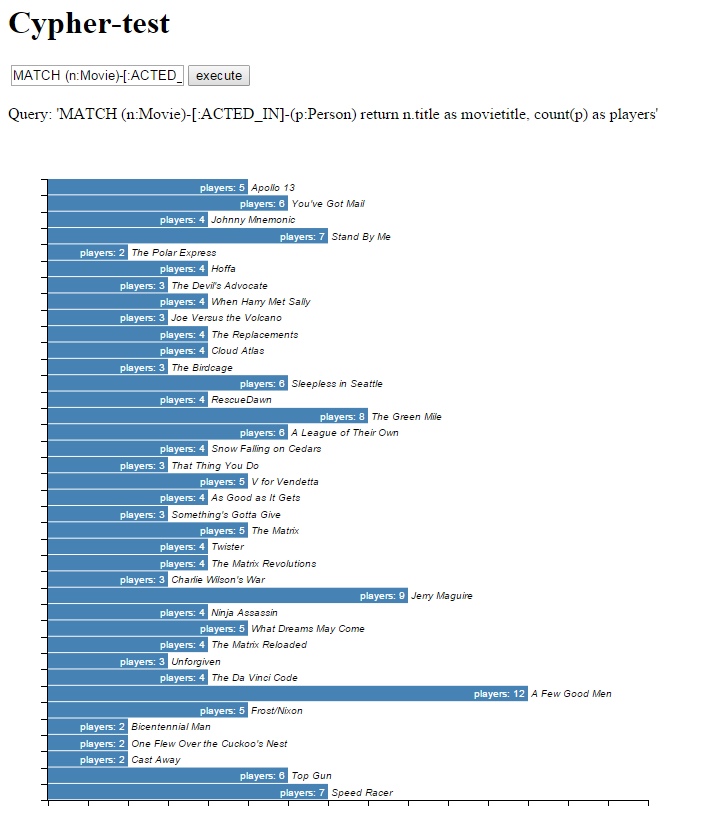
Unfortunately, at this point our barchart will look like this:

Unstyled d3 barchart
What happened was that we didn’t use ANY styling at all. That doesn’t look very nice, so we will add a stylesheet to the page. Note that you can style SVG-elements just as you can style standard HTML elements, but there is one caveat: the properties are different. Where you can use the color attribute (style="color:red") on an HTML element, you would have to use the stroke and fill attributes for SVG elements. Just the text element alone has a lot of options, as shown in this tutorial.
So, we now add a stylesheet at the end of the <head> section. We start with the definitions of the bars – they will be steelblue rectangles with white text. The standard text will be white, right-adjusted text that stands to the left of the starting point. The movie-text will be left-adjusted and stand to the right of its starting position, in italic black font.
<style>
#outputArea {
  height: 50px;
}

#outputArea rect {
  fill: steelblue;
}

#outputArea text {
  fill: white;
  font: 10px sans-serif;
  text-anchor: end;
  color: white;
}

#outputArea text.movie {
  fill: black;
  font: 10px sans-serif;
  font-style: italic;
  text-anchor: start;
}
Now we define the axes. They will be rendered with very small lines (crispEdges), in black. The minor tickmarks will be less visible than the normal tickmarks.
.axis {
  shape-rendering: crispEdges;
  stroke: black;
}

.axis text {
  stroke: none;
  fill: black;
  font: 10px sans-serif;
}

.y.axis text {
  display: none;
}

.x.axis path,
.x.axis line,
.y.axis path,
.y.axis line {
  fill: none;
  stroke: black;
  stroke-width: 1px;
  shape-rendering: crispEdges;
}

.x.axis .minor,
.y.axis .minor {
  stroke-opacity: .5;
}
</style>
And now, we get this:
Styled d3 barchart
We can add more bells and whistles, such as animations and nice gradients for the bars, but that’s something I’ll leave to you.
By the way: we can add SVG elements, but in the same manner we could also just add plain HTML elements and create a nicely styled tabular lay-out for the same data. Or we could create a Sankey diagram. But that’s something for another post.